FinOps
FinOps Engineer Notes Start
Q) How to describe the cloud costs, in its simplest form?
Cloud cost could be described as the product of the time/usage and the rate of the product.

Q) What are the examples calculations for both time-based resource and usage-based resource?
Time-Based Resource: Azure Virtual Machine:
A virtual machine bills for the exact duration it runs, regardless of how much CPU or memory the operating system actually consumes.
Assuming a Linux Standard_B2s VM in East US at an on-demand rate of $0.0416 per hour:
If the machine runs continuously for a 30-day month (720 hours):
720 hours × $0.0416/hour = $29.95
Even if the instance sits completely idle with 0% CPU utilization, you pay for the reserved capacity across those 720 hours.
Usage-Based Resource: Azure Functions (Consumption Plan)
Serverless execution does not charge for idle infrastructure. Billing triggers strictly on events processed and the compute resources consumed during execution.
Execution cost is measured in gigabyte-seconds (GB-s), calculated as memory allocated multiplied by run duration, priced at $0.000016 per GB-s (beyond the monthly free tier).
If a function configured with 512 MB (0.5 GB) of memory executes 2,000,000 times in a month, with each run taking an average of 500 ms (0.5 seconds):
Total billable consumption:
2,000,000 runs × 0.5 seconds × 0.5 GB = 500,000 GB-s
Cost calculation:
500,000 GB-s × $0.000016/GB-s = $8.00
If no requests hit the endpoint, the consumption count is zero, resulting in zero compute cost.
Q) What is the key objective of the finops teams?
Promoting both cost avoidance (related with the time/usage), and cost optimization (related to the rates).
FinOps teams focus on both cost optimization, so that the resources will only be used when they have to be used; and rate optimization, so that the the tier of the resource that we use is in alignment with our business requirements. In other words, we pay the least amount without giving any compromises from our needs.
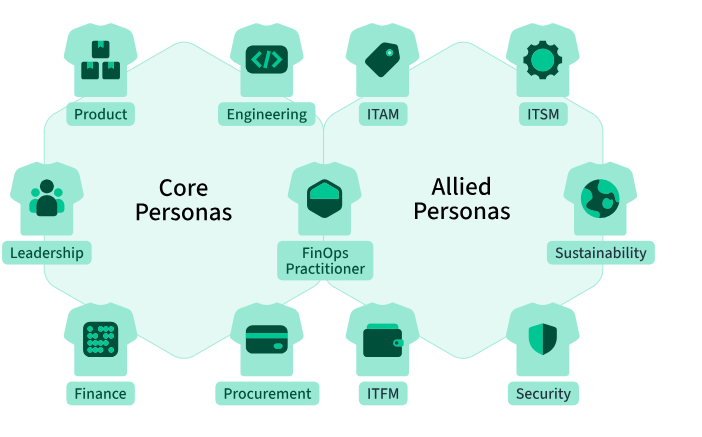
Q) Who are the key personas that are included in the FinOps Practices?
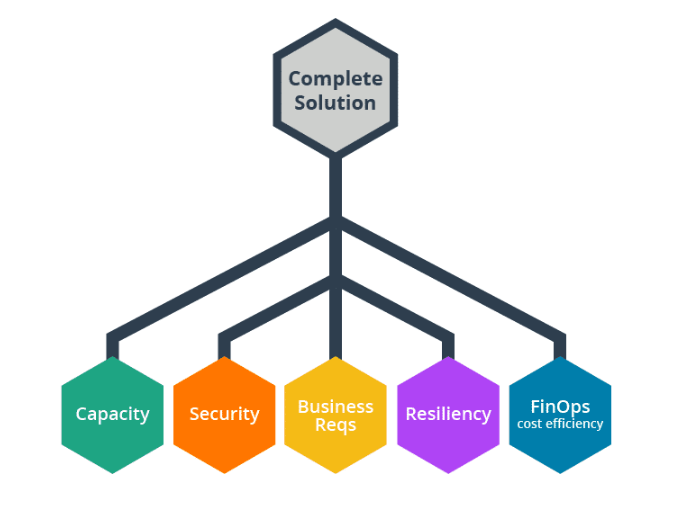
Q) What are the key components of a well-designed solution?
Q) How the traditional way of technology spendings (on-premise world) look like?
- Engineers acting as requestors for the hardware needed to satisfy the business requirements
- Procurement and finance teams acting as gatekeepers to allow access to funds to purchase the equipment
- Spend is predictable and static with fixed, known cost (CapEx)
- The infrastructure purchased is always over-committed, to handle the load, if it ever takes place
- Improper resource procurement poses a significant financial risk.
Q) How did the advent of cloud change the traditional way of technology spendings?
- Engineers do have the ability to deploy resources that incur costs, that actually eliminates the procurement/finance team approval in the cost allowance process
- Finance team has less visibility over the costs, since the pay-as-you-go model does not give the comfort that they had with the capex model
- Spend is dynamic and can change based on consumption and tier configurations
Q) What are the operating models of cloud usage?
- Centralized: A central cloud team manages all cloud resource deployments - they act as a gate between other teams and the cloud.
- Shared Platform: Centralized team offers a platform that abstracts away the direct access to cloud API, so that the engineers consume the APIs provided by the platform to deploy resources.
- Fully Distributed: All teams have access to cloud to deploy their own resources. There might a be centralized team, that is named as Cloud Center of Excellence (CCoE) that defines the policies, access rights, permissions that the engineers must adhere to.
Q) How the yearly budget should be divided into monthly budgets?
Simply dividing the yearly budget into 12 does not make any sense, since number of days of each month within a year varies.
Let’s say, we follow standard division by 12, and then in february, the reports will show that we’ve saved some money, since the number of days is less than the average days of month (30 days).
However, in March, we’ll see a jump in cost, compared to February - and this deviation might state false-positives and false-negatives on our visibility dashboards.
Because of that, the number of hours should be taken into account. Each month, should get its budget, based on how long it is in terms of hours.
Q) How does the the medallion architecture look like in practice?
Bronze: Raw Event Record
An append-only, unparsed JSON payload stored directly in object storage:
{"event_id": "evt-90412", "timestamp": "2026-09-03T08:12:01Z", "payload": "{\"order_id\":\"ORD-5501\",\"email\":\"jane@example.com\",\"items\":[{\"sku\":\"SKU-99\",\"qty\":\"2\",\"price\":\"15.50\"}]}"}
Silver: Cleaned and Normalized Tables
Typed, deduplicated, and split into relational tables with enforced foreign keys:
fct_orders
| order_id | customer_email | order_timestamp | status |
|---|---|---|---|
ORD-5501 | jane@example.com | 2026-09-03 08:12:01 | COMPLETED |
fct_order_items
| order_item_id | order_id | sku | quantity | unit_price | line_total |
|---|---|---|---|---|---|
ITM-01 | ORD-5501 | SKU-99 | 2 | 15.50 | 31.00 |
Gold: Aggregated Business Mart
Pre-joined and aggregated into an analytical star-schema table for dashboards:
agg_daily_sku_sales
| date | sku | total_units_sold | total_revenue_usd |
|---|---|---|---|
2026-09-03 | SKU-99 | 2 | 31.00 |
Q) How does Disney’s FinOps Data processing look like?
Here’s how Disney manages the spendings data, collected from various endpoints:
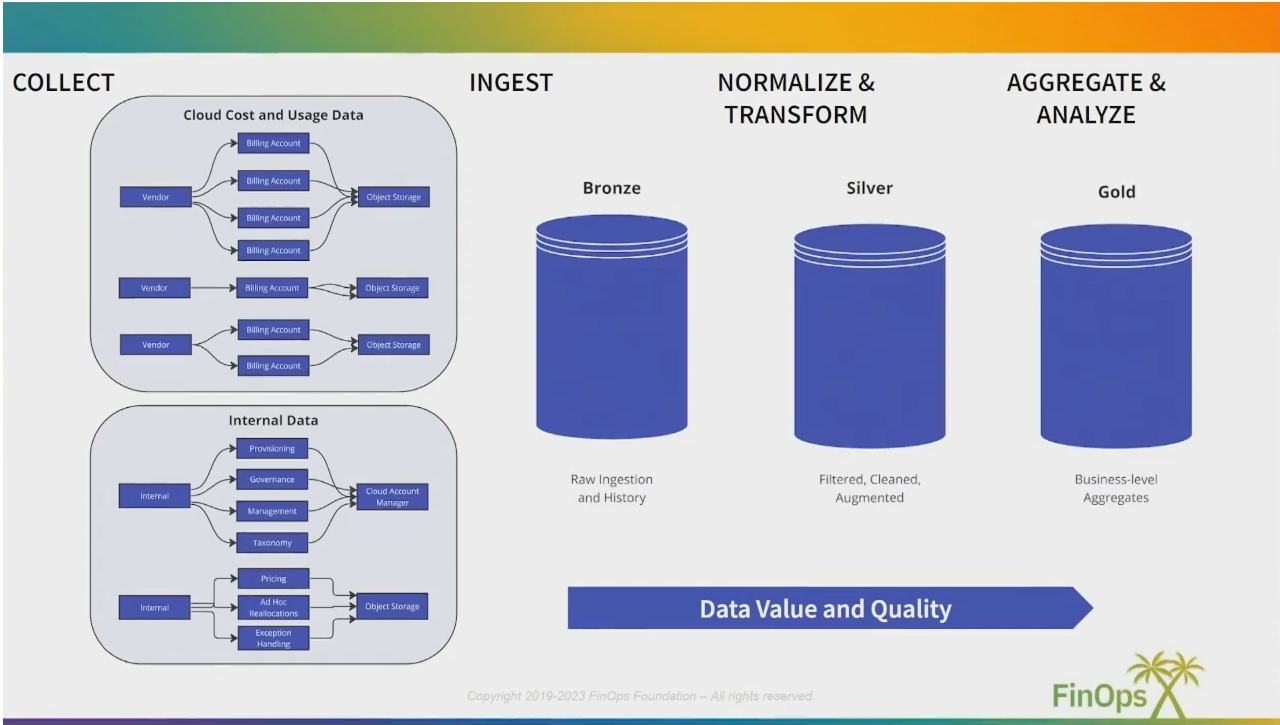
Cloud Cost and Usage Data (External)
- Represents the literal vendor invoice from cloud service providers (e.g., Azure, AWS, GCP). It contains purely provider-side charges such as virtual machine compute hours, storage consumption, network egress, and managed services.
Internal Data (Organizational Context)
Does not represent an external bill, invoice, or network data transfer fee. Instead, it serves as an internal translation and metadata layer that provides business context to the provider invoice. This includes:
Organizational taxonomy (mapping subscription IDs and tags to business units, cost centers, and application owners).
Shared platform reallocation models (apportioning costs for central infrastructure like shared clusters or transit networks).
Financial adjustments (applying enterprise discount structures, commitment normalization, and internal amortization models).
Q) What’s the definition of savings?
It’s the difference between your budget, and your actual spending.
Q) What is the difference between savings, spend reduction and cost avoidance?
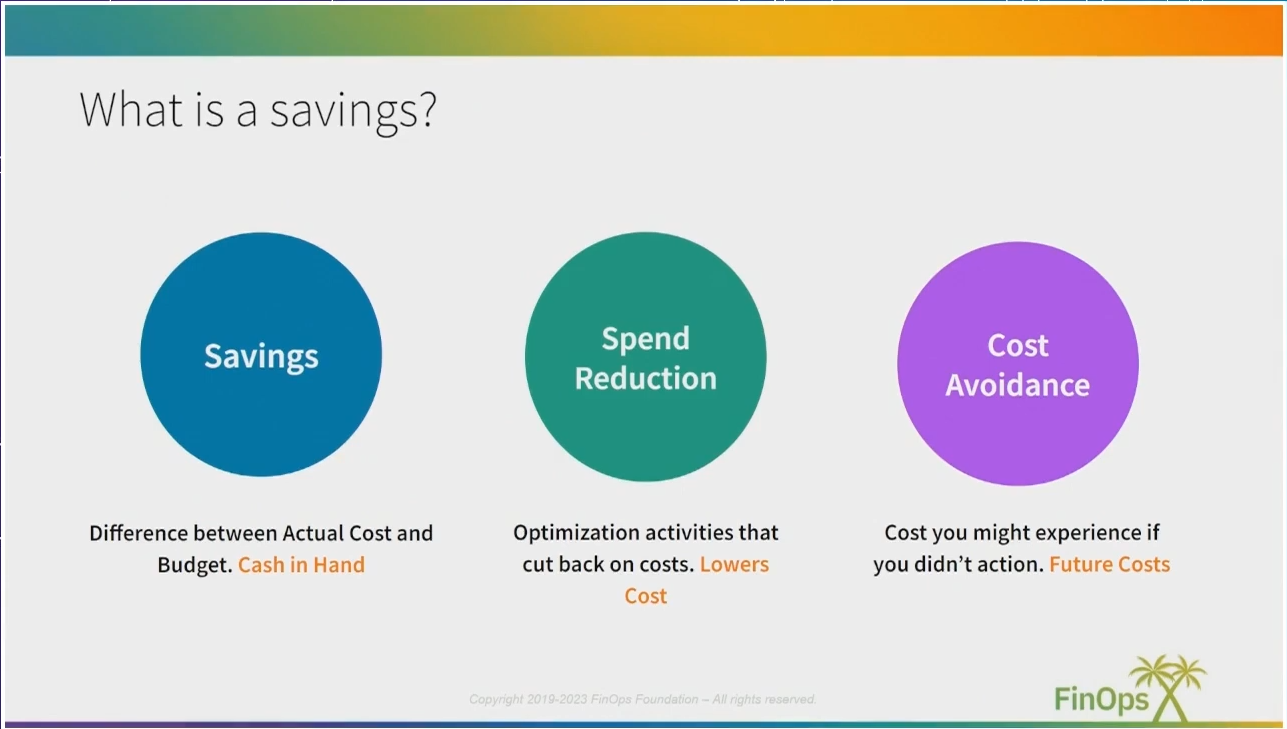
- Savings:
Budget - Actual Cost - Spend Reduction:
Previous Month's Actual Cost - Current Month's Actual Cost - Cost Avoidance:
Next Month's Forecasted Cost - Next Month's Actual Cost
Q) What’s run rate?
Run rate is a way of forecasting future financial performance by taking current, short-term numbers and projecting them over a longer period, assuming conditions stay the same.
In budgeting and cost management, think of it like your speedometer. If your current cloud infrastructure or team operations cost $10,000 this month, your annual run rate is $120,000 ($10,000 × 12). It gives you a baseline “business-as-usual” trajectory before you layer in growth, project-based decreases, or seasonal fluctuations shown on the slide.
Q) How does the tracking of expenses of individual business units should take place?
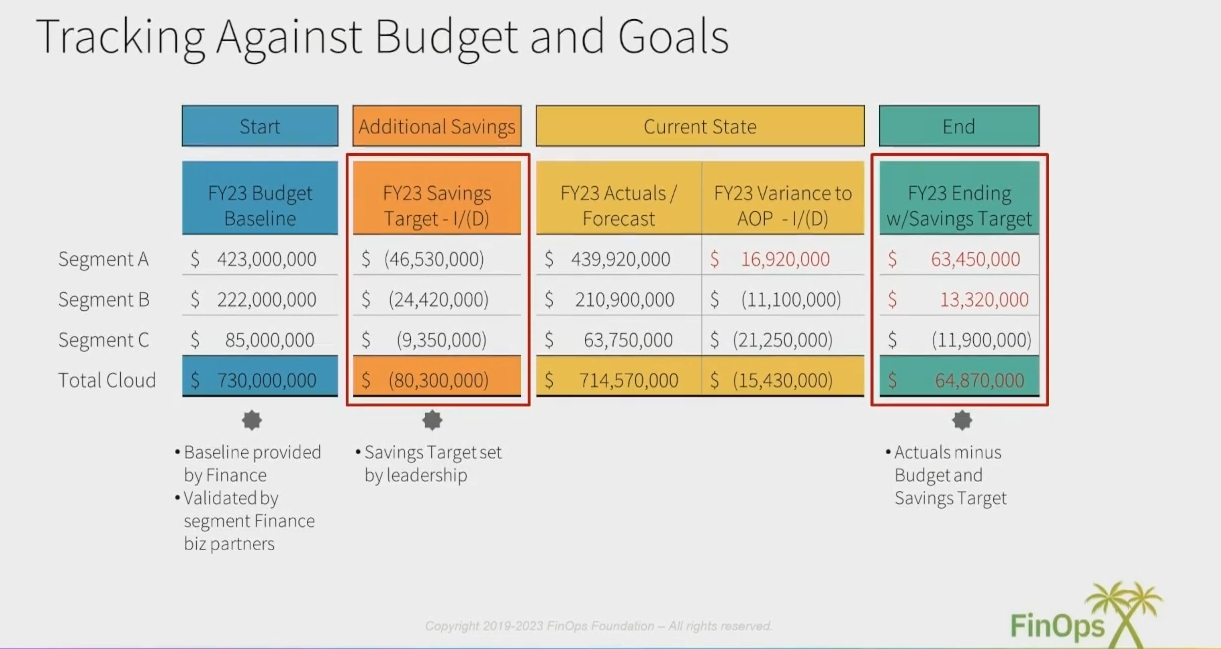
AOP stands for Annual Operating Plan. In corporate finance and FinOps, this is the formally approved yearly financial budget baseline against which performance and cloud spend are measured. In the table, “FY23 Budget Baseline” represents this AOP figure.
I/(D) stands for Increase / (Decrease). Standard financial notation uses regular numbers to denote positive amounts or increases, and parentheses around a figure to represent negative amounts or reductions.
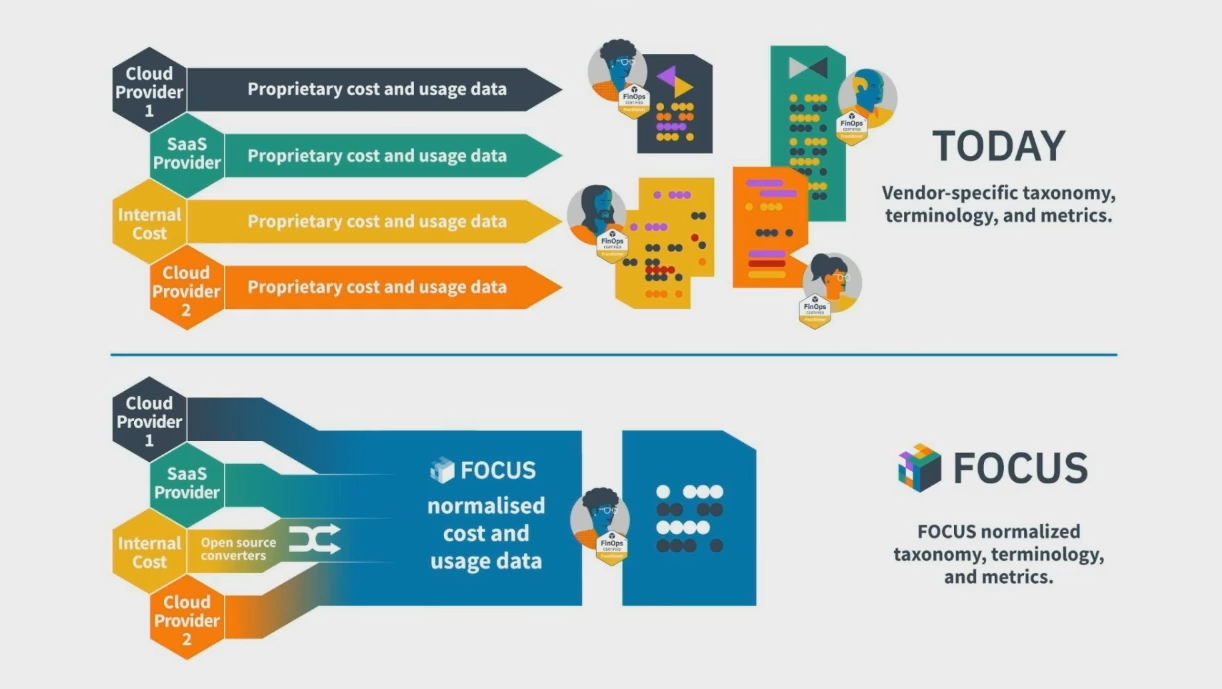
Q) How does FOCUS help businesses in terms of cost visibility?
Q) What are the greenhouse gases?
These are the gases that absorb and reemit heat. The more they are in the atmosphere, the more our world gets heated up. To give some example to these gases, we can state carbon dioxide (CO2), water vapor, methane (CH4), nitrous oxide (N2O), and ozone.
Q) What is carbon dioxide equivalent (CO2e)?
It gives one metric to represent the impact of any gas in terms of global warming potential.
Q) What are the categories of carbon emissions?
The question to ask for: Where does the smoke come from? If your facility, that’s scope 1. If someone else’s facility, and you use the energy service that they provide, that’s scope 2. If you see or do not see the smoke, but you use their services other then energy resources, that’s scope 3.
Scope 3 is where 100% of the cloud providers’ emissions fall into.
The FinOps practices are there to measure scope 3 emissions to identify sustainability opportunities.
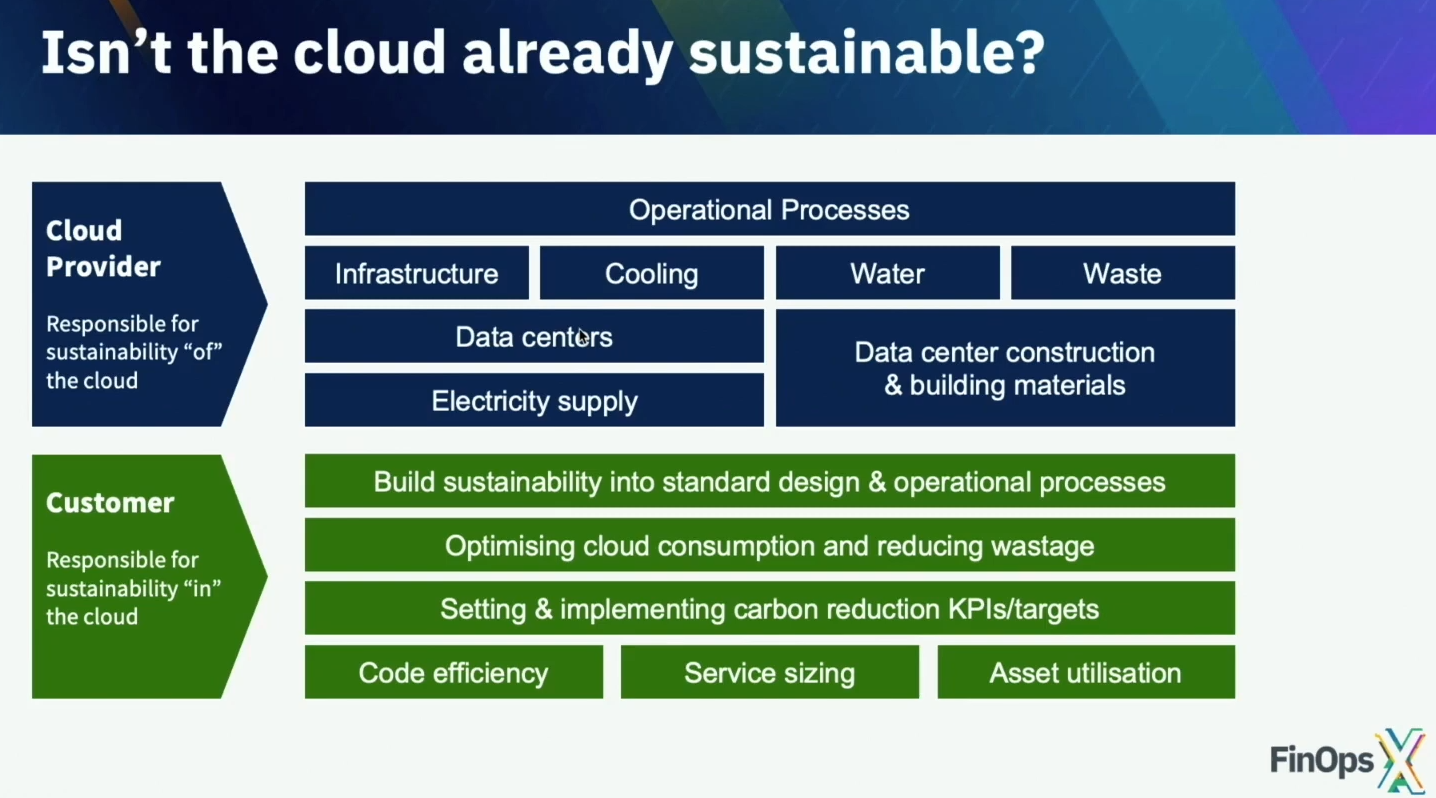
Q) How should the seperation of responsibilities between cloud vendor and consumer look like, in terms of sustainability?
Q) Do all finops actions to save costs have a positive impact on sustainability?
No - for instance, having reserved plans for longer time period commitment might actually work in the opposite direction, that would increase the carbon footprint.
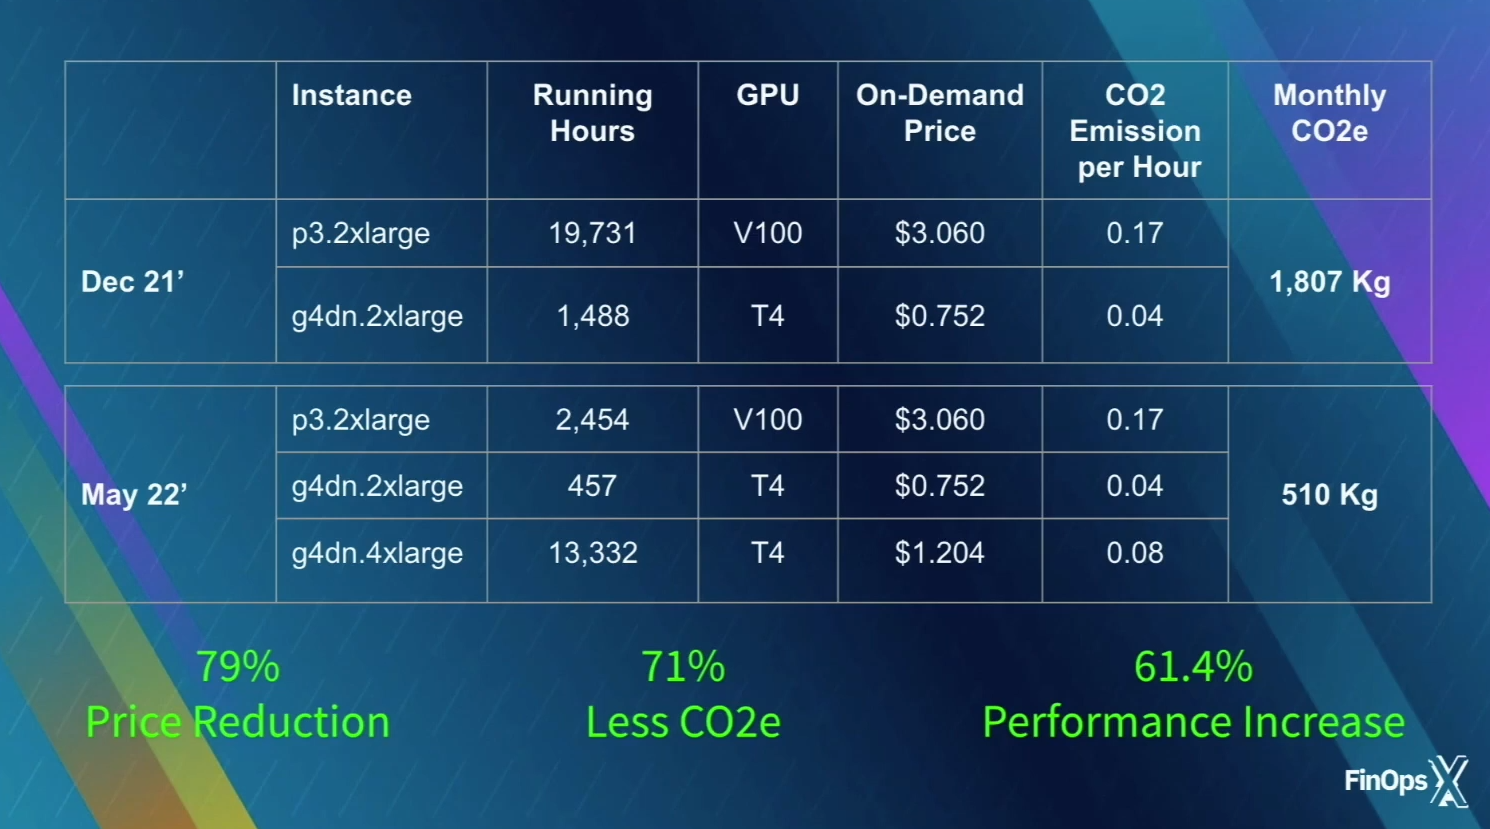
Q) How does an example of virtual machine optimization on AWS in terms of sustainability?
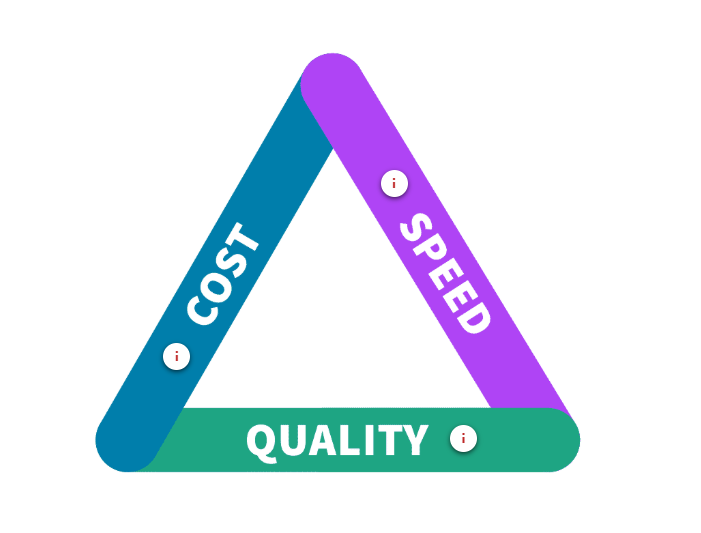
Q) What is Iron Triangle?
It’s an illustration that shows the tradeoffs that the engineers do between cost, speed and quality. Usually, we prioritize two out of three, because it’s not possible to optimize each of the pillars at the same time.
Q) What are the different categories for cost optimization?
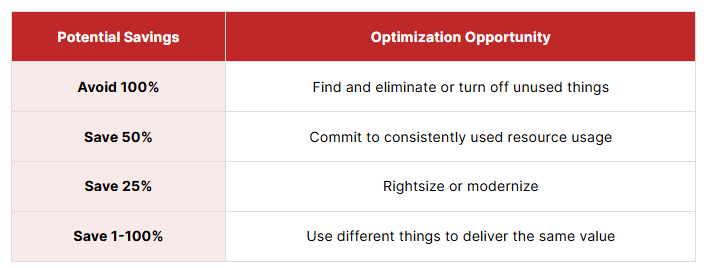
Q) What are the sample practices of cost optimization?
Turn off/turn on development, test, sandbox environments
Create/manage storage policies to deprecate storage over time to cheaper tiers
Rightsize compute, databases, networks, environments
Change from 3rd party licensed resources to cloud native resources
Move to/expand use of containers
Move to serverless
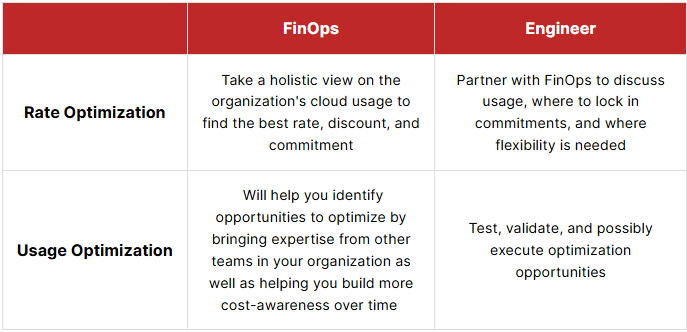
Q) How the responsibility share between engineers and practitioners look like, in terms of cost and rate optimization?
Q) What is Informed Ignoring?
There’s an optimization that you can do, however instead of doing that, you realize that the feature that you’d like to ship carries more importance than the optimization. This needs to be elaborated to the stakeholders, and it should not be seen as ’never-do’. The optimization should be set aside, and needs to be taken care of when the time requires in future.
Q) When to automate?
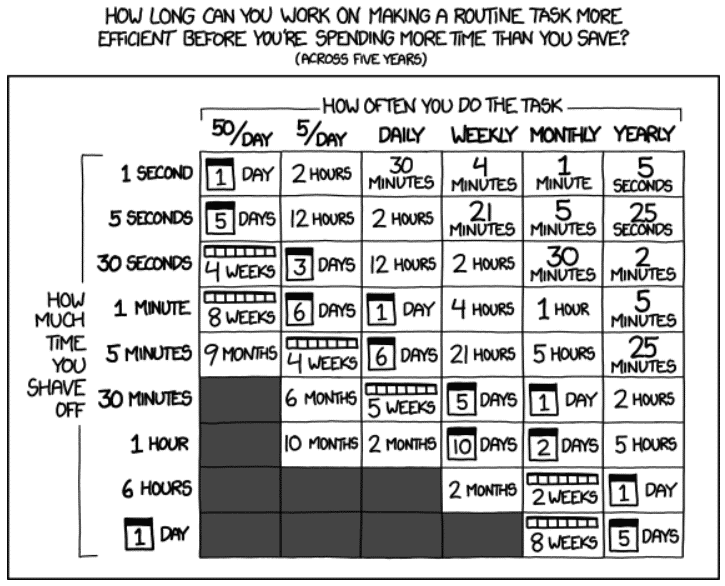
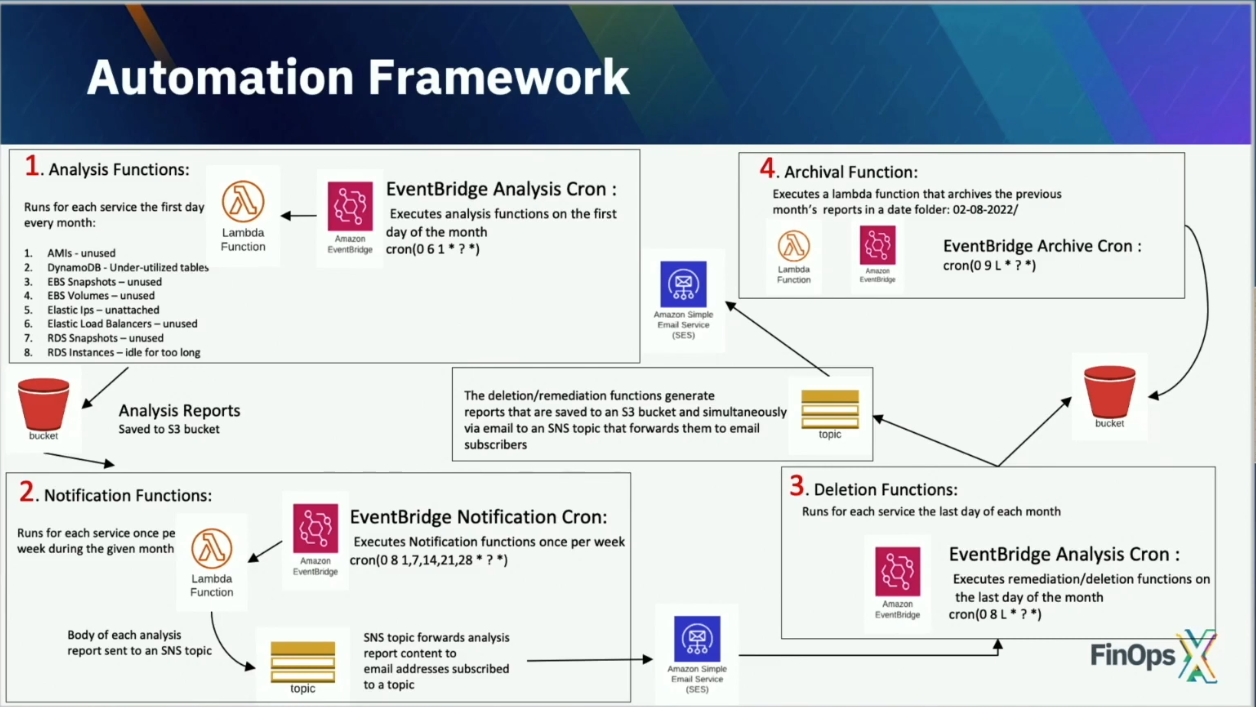
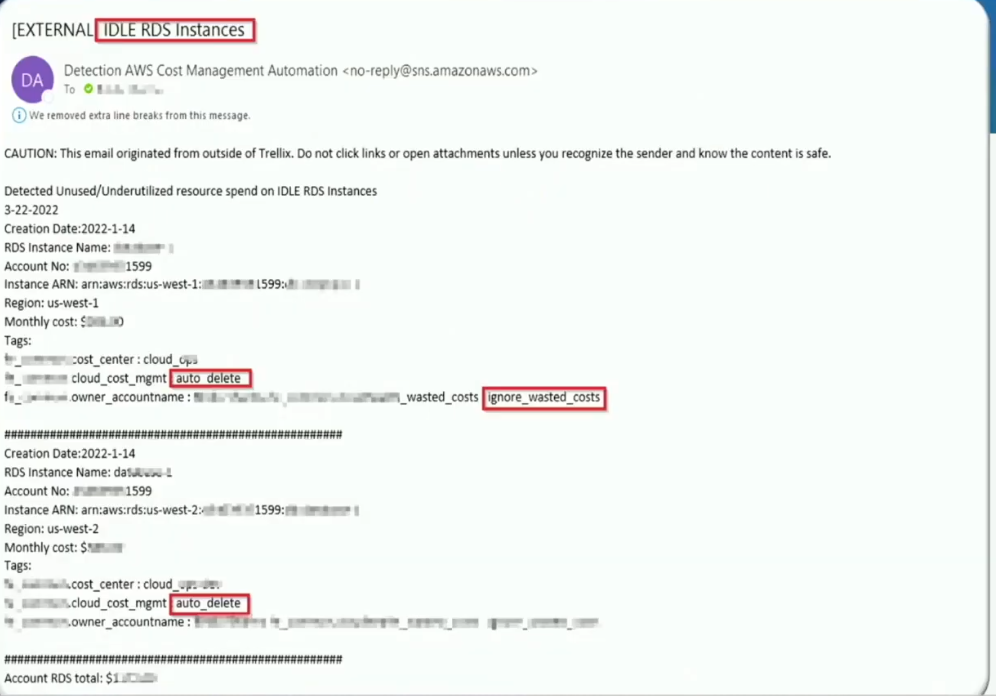
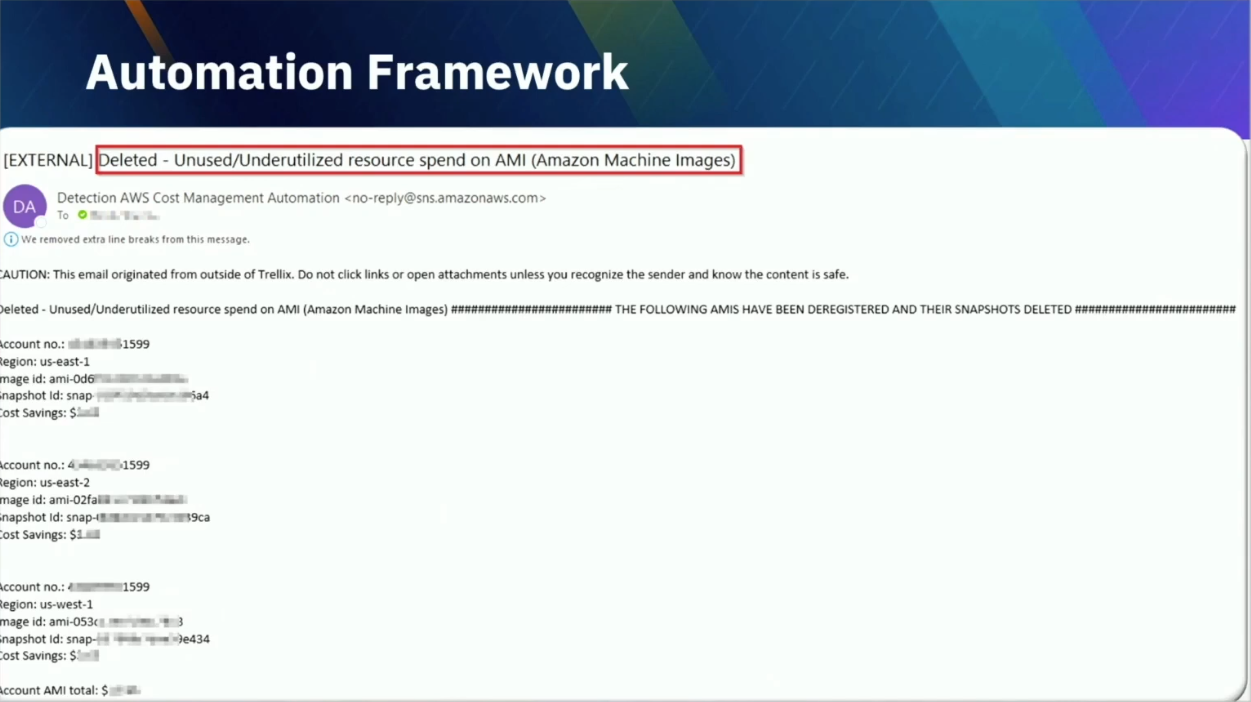
Q) How does FireEye’s automation framework and an email templates look like?
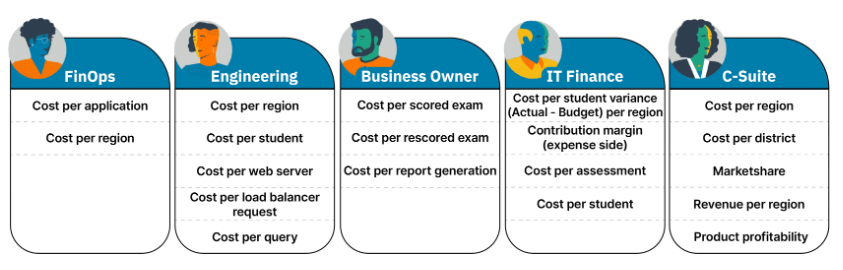
Q) How do the individual unit metrics differ across different business units, for a specific company?
Let’s say, we are operating as an online exam provider company, where we test our students’ capabilities focused on the exam that they have registered to. The metrics might look like as following:
Q) What is Customer Lifetime Value (CLV) and Customer Acquisition Cost (CAC)?
Let’s try to explain these two metrics with an example.
Consider a B2B SaaS company that sells workflow automation software.
The company charges an average monthly subscription of $200 per customer. Providing the cloud infrastructure and direct support costs $40 per user each month, leaving an 80% gross margin. On average, 2.5% of active customers cancel their subscription each month, meaning the monthly churn rate is 0.025.
To find the average customer lifespan in months, divide 1 by the monthly churn rate:
$$\text{Average Lifespan} = \frac{1}{0.025} = 40 \text{ months}$$
Now, compute the customer lifetime value by factoring in monthly revenue, gross margin, and expected lifespan:
$$\text{CLV} = $200 \times 0.80 \times 40 = $6,400$$
Alternatively, using the direct recurring-revenue formula yields the exact same outcome:
$$\text{CLV} = \frac{$200 \times 0.80}{0.025} = $6,400$$
This result means that after accounting for the ongoing cost of delivering the software, each newly acquired customer brings in $6,400 of net gross profit over their 40-month relationship with the business.
Now consider how the company applies this number to strategic decisions:
If the marketing and sales team spends $1,600 on ad spend, outbound SDR outreach, and onboarding collateral to sign up one customer, the LTV:CAC ratio is:
$$\frac{\text{LTV}}{\text{CAC}} = \frac{$6,400}{$1,600} = 4:1$$
A 4:1 ratio signals strong unit economics. The business can comfortably reinvest in paid acquisition channels because each customer generates four times their acquisition cost in gross profit.
Suppose the engineering and customer success teams roll out an improved onboarding flow that drops monthly churn from 2.5% down to 2.0%. Lifespan expands from 40 months to 50 months ($1 / 0.02$). Without raising prices or spending an extra dollar on marketing, the new CLV jumps to:
$$\text{CLV} = \frac{$200 \times 0.80}{0.02} = $8,000$$
A half-percent drop in monthly churn immediately increases the enterprise value of every acquired customer by $1,600, demonstrating why retention improvements often produce higher leverage than scaling raw top-of-funnel acquisition.
CLV is meaningless in isolation; it is almost always evaluated against Customer Acquisition Cost (CAC). In sustainable businesses, a common target is an LTV:CAC ratio of 3:1 or higher. If LTV is $300 and acquiring that customer costs $100, the business has room to cover overhead and generate profit. An LTV:CAC below 1:1 means every acquired customer destroys capital.
FinOps Engineer Notes End
Q) What is the difference between Actual Cost and Amortized Cost?
Consider a platform team managing a hub-and-spoke landing zone setup under a central billing account. To optimize compute spend, the team purchases a 3-year Azure Compute Savings Plan upfront for $36,000, which applies globally across multiple application landing zone subscriptions, such as sub-app-prod-001 and sub-app-dev-001.
Under Actual Cost, the entire $36,000 invoice charge is logged on Day 1 against the central management subscription where the savings plan was purchased. In Month 1, the central platform team’s budget shows a massive $36,000 spike, while Months 2 through 36 show $0. Meanwhile, sub-app-prod-001 and sub-app-dev-001 consume compute hours throughout the year without reflecting any share of that upfront commitment on their monthly invoices, making workload teams appear artificiality cheap to run.
Under Amortized Cost, Azure Cost Management breaks down the $36,000 upfront purchase into $1,000 per month ($33.33 per day) and redistributes that cost directly to the individual landing zone subscriptions based on their actual hourly compute consumption. If sub-app-prod-001 consumed 70% of the discounted compute hours in a month and sub-app-dev-001 consumed 30%, amortized reporting allocates $700 to the production landing zone and $300 to the dev landing zone.
Actual cost is used by finance for cash-flow management and paying the monthly Microsoft invoice. Amortized cost is used by cloud engineers and FinOps teams to establish accurate unit economics, track real subscription consumption, and fairly attribute shared commitment discounts across landing zones.